If you’re looking to scale your business or simply forecast revenue more accurately to be prepared for the future, you may be wondering how to use Excel to create a forecast sheet.
Sales forecasting offers a critical snapshot of revenue to be generated by future sales. But it’s not the whole picture. Revenue forecasting offers a better look at your overall financial picture based on historical data points and past sales revenue.
Importance of Revenue Forecasting
Accurately forecasting revenue can help you:
- Predict your company’s growth rate
- Free up working capital
- Manage your production schedules
- Manage cash flow
Accurate forecasting data takes into account aspects like seasonality, historical sales figures, and sales trends. Combining the right data with the right revenue forecasting methods in Microsoft Excel can help you understand what you can expect for a given time period like the next month or the next sales quarter.
When you forecast revenue growth in excel, the spreadsheet software creates a worksheet with a table of past data, predicted sales trends, and a chart showing the data.
How to Create a Revenue Forecast in Excel: 3 Forecasting Methods
Sales teams, finance, and accounting departments use several different methods to forecast sales revenue in Microsoft Excel. There are three main methods that will help you figure out how to forecast revenue growth in Excel that we’ll discuss in this guide: Moving Averages, Exponential Smoothing, and Linear Regression.
Moving Averages
This model accounts for micro-deviations in a given time period to create a stable trendline that helps you predict future sales. As time goes on, the oldest data drops off to predict a new revenue average for the upcoming time period. Hence, the name “moving averages.”
Pros:
- Useful for short-term forecasting trends and sales revenue
- Forecast changes over time
- Accounts for micro-deviations to get a more clear and accurate forecast
- Purely objective based on historical data
Cons:
- Does not account for seasonality in sales
- Cannot accurately forecast beyond the historical data available
- Does not account for marketplace changes, as it’s only looking at past sales data
- Data entry errors can create inaccurate forecasting
- Does not factor in the current sales pipeline or size of market
Exponential Smoothing
Exponential smoothing, such as ETS (error, trend, seasonal), accounts for seasonal patterns in sales revenue. As with the Moving Average method, Exponential Smoothing compensates for random variables. In essence, it “smoothes out” your data.
Depending on the age of your company and the quantity and quality of your historical data, you can calculate sales revenue into next yearExponential Smoothing methods like ETS also attribute the value of data differently depending on how old it is. When you input time series data, newer data receives a higher value than older data to create more accurate predicted values.
Business professionals often use one of three types of Exponential Smoothing methods:
- Simple exponential smoothing works similar to the Moving Average method, but weights older data as less significant.
- Double exponential smoothing helps spot trends over a time period
- Triple exponential smoothing explores multiple variables to predict both trends and seasonality
Pros:
- Useful for longer-term sales forecasting
- Accounts for seasonality in sales and revenue trends
- Weighted variables may provide more accurate future values
- Easy to use
Cons:
- Data entry errors can create false predictions
- Fails to account for market trends or real-world changes in real time
- Forecasts may lag behind actual market trends
- Exponential Smoothing
Linear Regression
Linear regression forecasting helps business owners, sales professionals, and finance and accounting teams analyze the relationship between two variables. For instance, you can observe the relationship between a direct email campaign and sales across a specific time frame.
Once you’ve mapped the relationship between two variables in Excel, you can use the forecast function to predict revenue.
Linear regression revenue forecasting is a simple-to-use process that relies on historical data to predict future trends such as revenue growth or product demand. It can also help you gauge the success of various sales funnel activities or marketing campaigns and their relationship to conversions and sales revenue.
Pros:
- Easy to use and understand
- Helpful to view the relationship between variables
Cons:
- Correlation may not equal causation, which can lead to inaccurate forecasts
- Assumes a linear relationship between x_values and y_values, without taking into account other real-world factors
- Dependent on accurate data entry
- Cannot be used to predict seasonal trends
- Historical data may not predict future trends
Moving Averages Revenue Forecasting in Excel
To use Excel to create a forecast with moving averages, follow these steps.
- Create a new sheet and enter your historical data for a given time period. – You can use the Moving Averages model for a time frame as short as a week or as long as you’d like.
- Calculate the mean sales revenue across your selected time period. – Use the “Average” function. EX: =AVERAGE(G2:I2) for a three-month time period in the image below.
- Alternatively, you can generate an Excel chart for easier data analysis at a glance. – Create a chart using historical data for a given time period. Click the plus icon and highlight “Trendline.” Right-click to choose “more options.” Then, select “Moving Average” and select your preferred time period. You will generate a line chart to help you spot sales trends and make predictions.
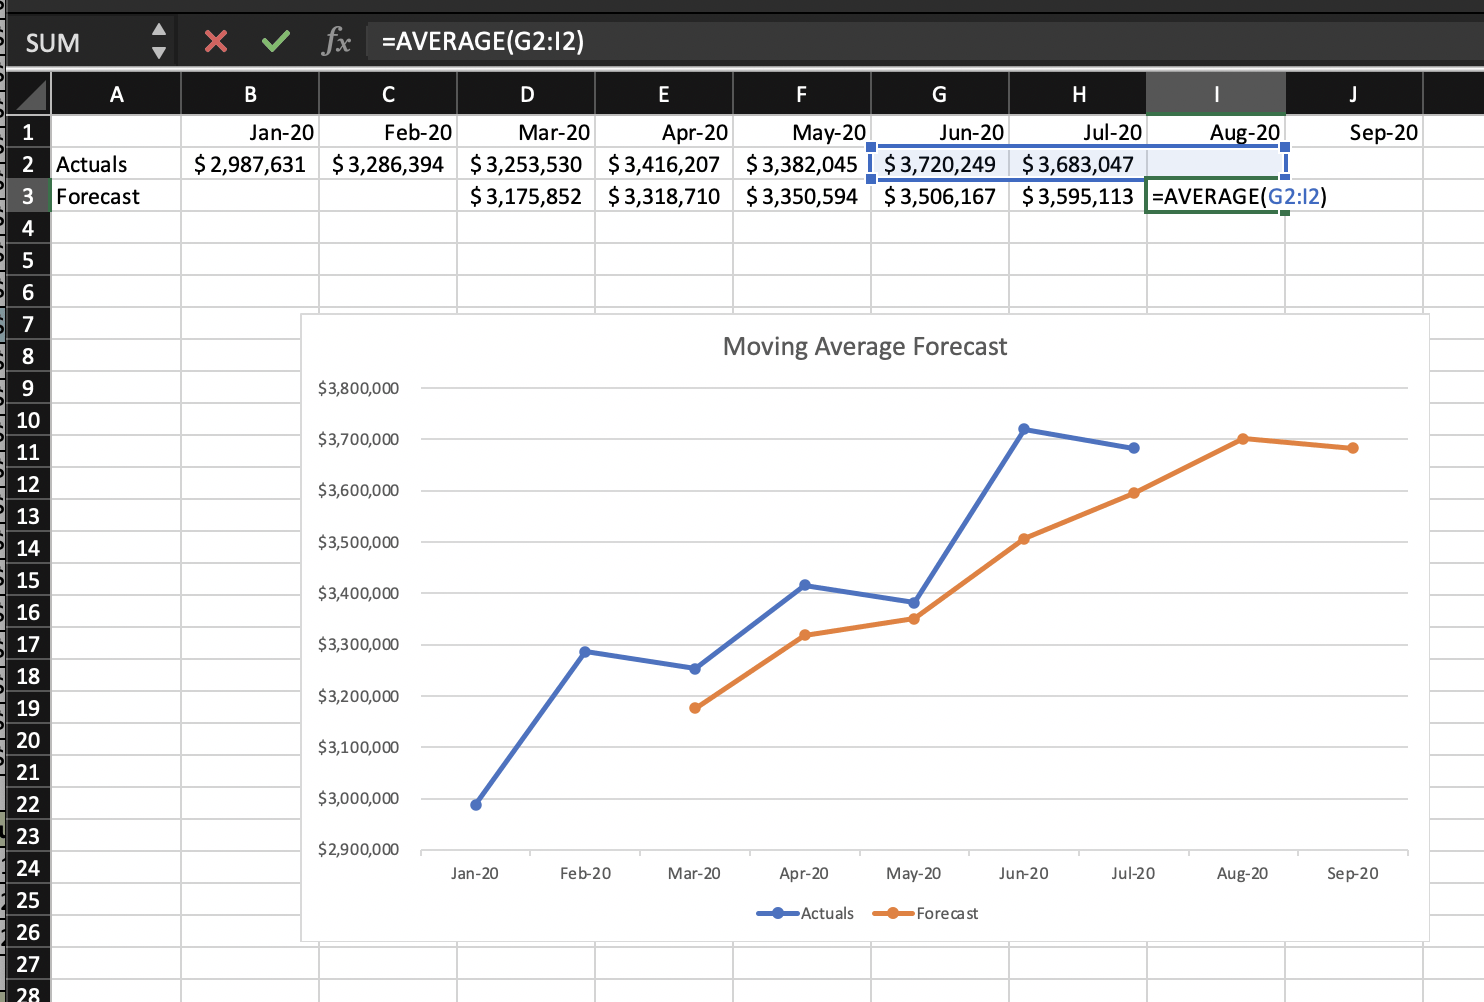
Note: Creating a visual representation of sales revenue forecasting can help your sales team set goals and help your accounting department make better short-term financial decisions. Yet, moving average forecasting may fall prey to faulty data analysis. If those reading the chart or spreadsheet draw inaccurate conclusions based on past trends, forecasts may be wrong.
Exponential Smoothing of Revenue in Excel
Here’s how to forecast using exponential smoothing of revenue in Excel:
- Create a new worksheet and use Excel’s Forecast Sheet feature to create formulas and charts. – You can choose from a column chart or line chart.
- Select an end date for your forecast. – Keep in mind, simple exponential smoothing works best for short-term predictions, but you can use triple exponential smoothing to make seasonal predictions.
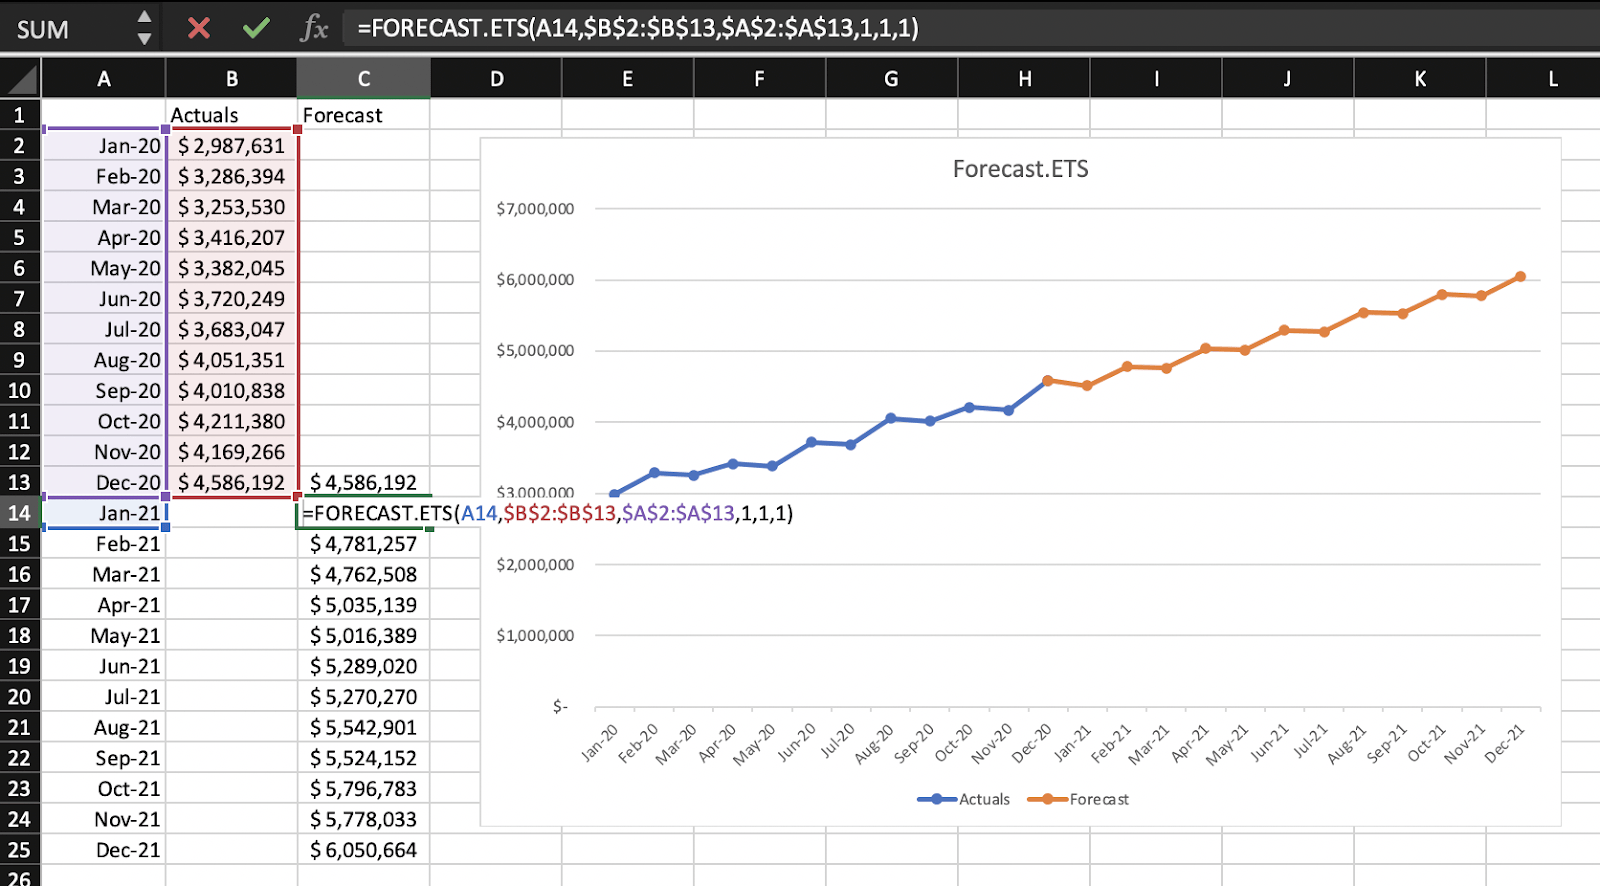
- Excel creates a new worksheet. – The new worksheet displays three columns, showing the forecast and boundary values for the confidence interval, or the range where future values should fall. The FORECAST.ETS function calculates these forecast values by creating an ETS algorithm based on the historical data and the time frame.
- Customize your data. – Your forecast values can change when you use the FORECAST.ETS function depending on a number of variables. These variables include confidence interval, seasonality, timeline range, and values range.
- Display forecast statistics, if desired. – You can use FORECAST.ETS.STATS to display smoothing coefficients.
Linear Regression Revenue Forecasting in Excel
Here is how to conduct Linear Regression Revenue Forecasting in Excel:
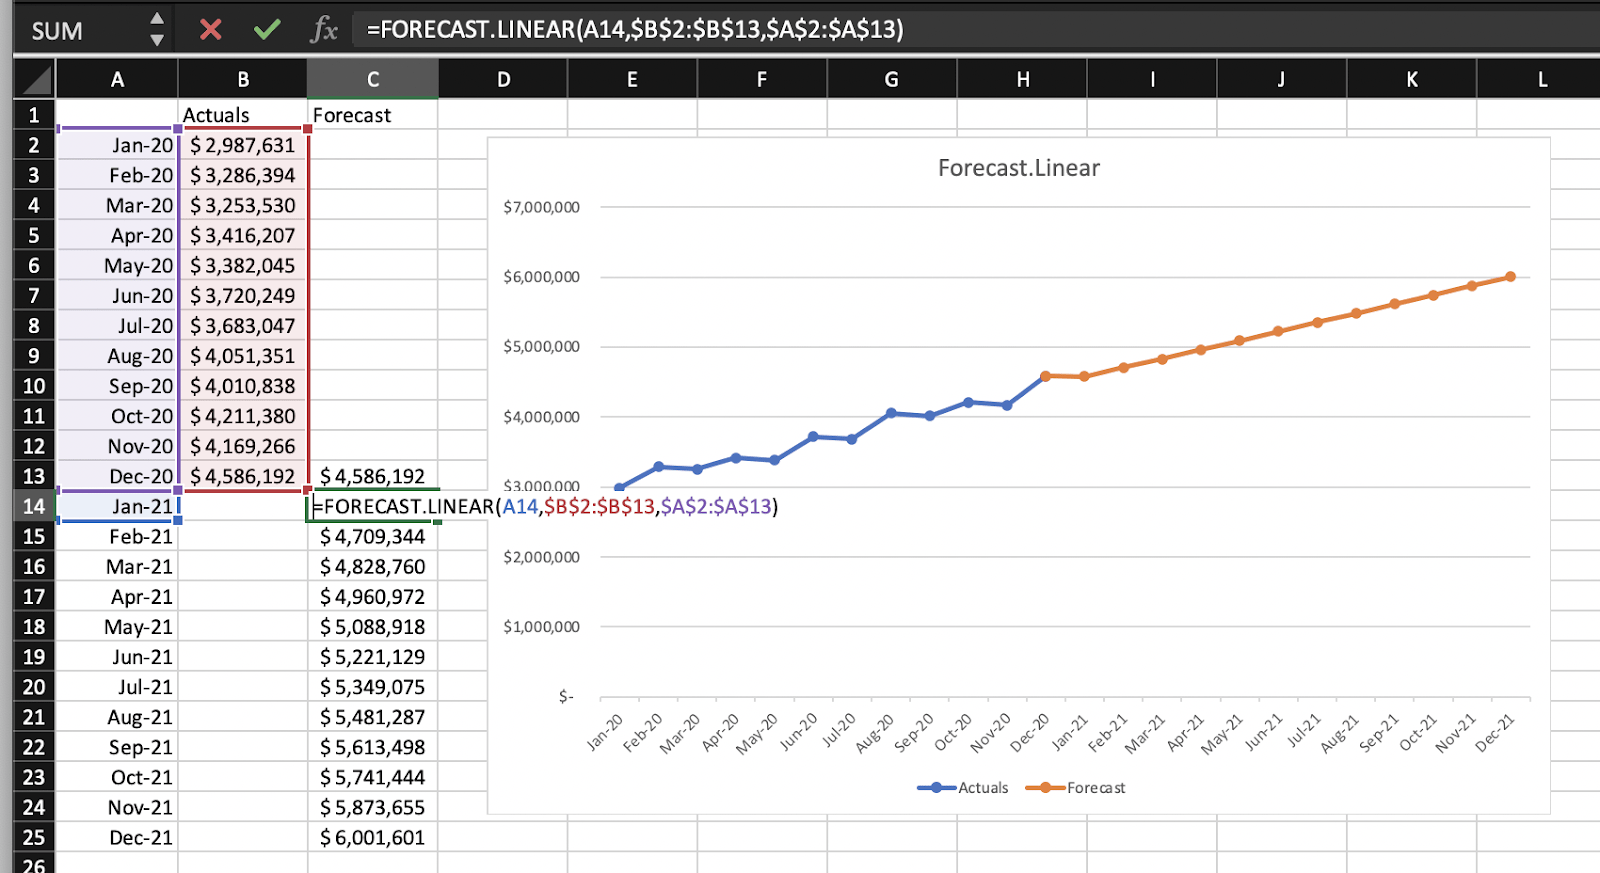
- Start a new worksheet and add timeline points – This determines the length of your forecast.
- Input x_values and y_values.
- Use the Forecast function to create a linear regression revenue forecast.
Pros & Cons of Using Excel
Excel provides an easy-to-use means of sales revenue forecasting that most individuals in an organization can easily access and view. However, it’s not without its shortcomings, especially if your organization doesn’t rely on the cloud-based Microsoft Office suite.
Pros
- Offers multiple means of financial forecasting
- Easy to use
- Easy to share amongst people in your organization
- Analyzes and forecasts based on objective historical data
Cons
- Manual process can fall victim to typos and data entry errors
- Forecasting is only as accurate as data entered
- Real-time data not available
- May not predict trends well
- Creates large files that may be difficult to share with those outside your organization
- Requires exporting data from SalesForce or other CRM systems
revVana Automates Forecasting Revenue
The methods above will help you determine how to project revenue in Excel, but you may still find the process difficult. The good news is that there’s an alternative: revVana is a cloud-based platform that solves the issues inherent in forecasting sales revenue via Excel by giving everyone in your organization access to real-time data and analytics.
Because revVana integrates seamlessly with SalesForce, sales numbers are always up-to-date. Very little-to-no modification in sales processes is necessary to create accurate sales revenue forecasts. revVana translates your sales data into actionable insights using sophisticated AI algorithms.
The best financial forecasts can help with financial planning and setting sales goals to enable your organization to maximize revenue.
You don’t have to train your sales team or finance department on new methods or learn a new program as revVana Plan automatically creates sales revenue forecasts in the background. Integrate revVana Plan with SalesForce and forecast revenue instantly at any time.
Reach out for your free demo now.
Learn more: 8 signs you’ve outgrown Excel for revenue forecasting